
Case Study
Modelling excavation dewatering for large excavations below the water table can be challenging.
These challenges arise because the excavation geometry changes as construction advances. The modelling complexity then increases as new wellpoints come online in stages and groundwater responds non-linearly to changes in pumping time, pumping location, and pumping rate.
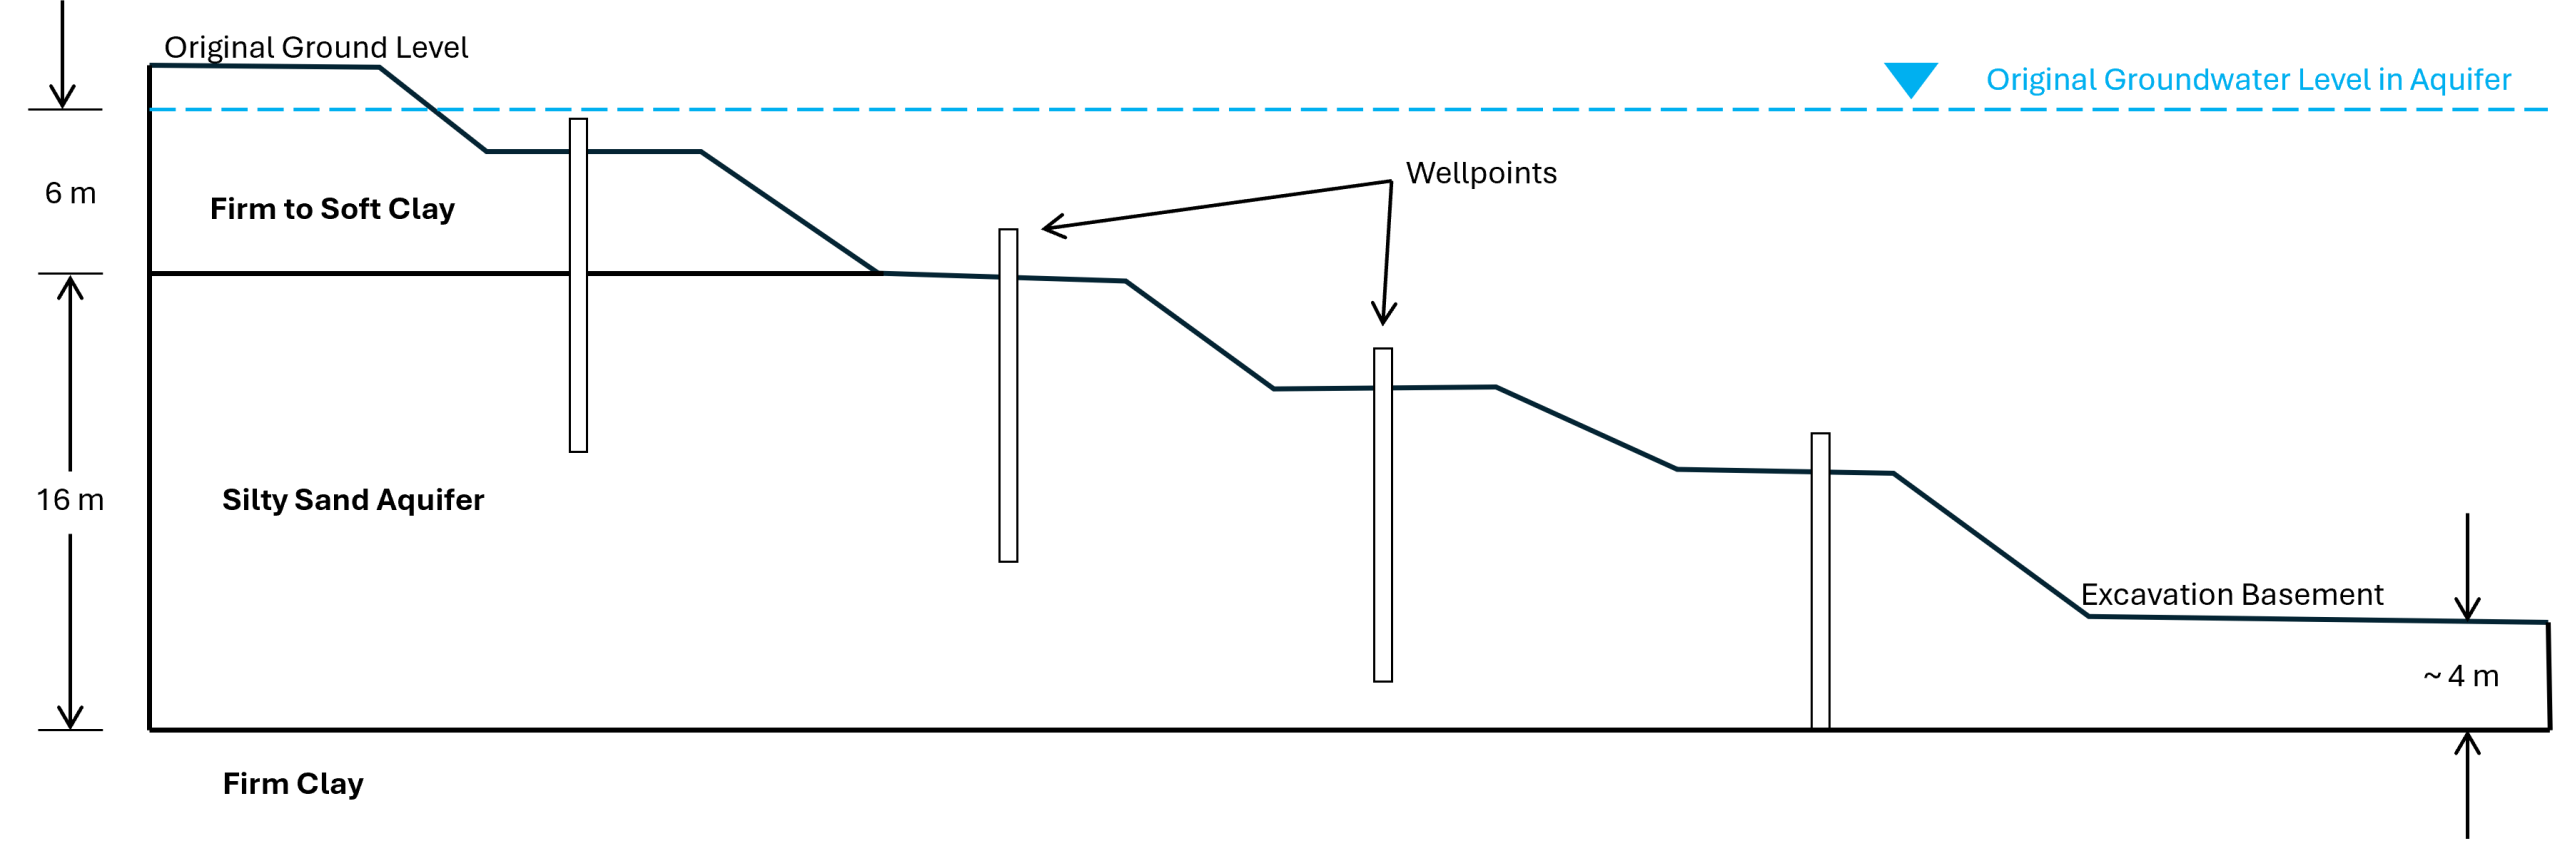
That was the challenge for a wastewater pump station excavation in İzmir, Türkiye. The project involved a 16 m thick silty-sand aquifer with sandy clay layers, which was initially confined artesian but transitioned toward unconfined conditions as dewatering progressed.
In this article, we show how the multi-staged wellpoint dewatering system was simplified into a 5-element Anaqsim model, then compare the simulated response with measured field behaviour.
Site conditions for the wellpoint dewatering model
The project sat within an alluvial fan area near the Bay of İzmir. The geology included approximately 6 m of firm to soft clay overlying about 16 m of silty sand with sandy clay layers. Beneath this aquifer, firm clay formed the lower boundary of the system.
Prior to dewatering, a pumping test provided the main hydraulic parameters for the silty sand aquifer. Based on that test, the reported average transmissivity was 66.7 m²/d, the aquifer thickness was about 16 m, and the hydraulic conductivity was approximately 4.2 m/d. The initial aquifer head was approximately 2 m above ground surface, indicating confined conditions before dewatering began.
The pump station excavation measured approximately 55 m × 95 m at the base and about 120 m × 160 m at ground surface. Groundwater lay close to ground surface, and construction required more than 18 m of groundwater lowering so the excavation could remain dry. Dewatering used a four-stage wellpoint system, with stages installed at approximately -2.0 m, -6.5 m, -11.0 m, and an average final-stage depth of -15.1 m below ground level. In total, the system included 1,624 wellpoints.

Building the Anaqsim model
Despite the apparent geological and excavation complexity, we built an Anaqsim model using only 6 line elements.
Our setup used one H-SEG boundary line element to define the external groundwater system. We then used an interdomain line element to define a 3-layer near-field subdomain around the excavation. Finally, we used four specified-head line elements to simulate the staged wellpoint system.
We did not simulate every individual wellpoint. Instead, each specified-head line element captured the hydraulic effect of one wellpoint stage. This reduced a large dewatering system into a small number of elements. It also preserved the main hydraulic response around the excavation.
To represent the aquifer near the excavation, we created three layers within the near-field subdomain. These layers were bounded by the interdomain line element. The layers roughly corresponded with the staged wellpoint system. The final two wellpoint stages were placed in the same bottom layer.
This layering allowed the model to simulate vertical flow around the excavation while avoiding unnecessary setup complexity across the full model area.
We did not include the overlying clay as a separate model layer. In Anaqsim, confined aquifer conditions can be simulated directly without explicitly including the confining geology. This kept the model focused on the aquifer being dewatered.
Image 2 below shows the Anaqsim model setup for Layer 1. The image includes the H-SEG boundary, the interdomain boundary around the near-field subdomain, and the specified-head line element for the first wellpoint stage. The other wellpoint stages were represented in the same way on deeper model layers.

Possible Anaqsim model variations
The setup described above used specified-head line elements to represent the staged wellpoint system. This worked well because each stage could be turned on and off to match the construction sequence.
Another option would be to use river line boundaries for the wellpoint stages. River line boundaries include an optional “dries up” setting, which prevents a boundary from adding water after groundwater levels fall below the assigned elevation.
That behaviour can be useful in staged dewatering models, especially when an earlier wellpoint stage becomes inactive as excavation proceeds deeper. For this case, we managed that behaviour by sequencing the specified-head line elements directly.
Wellpoint dewatering model results
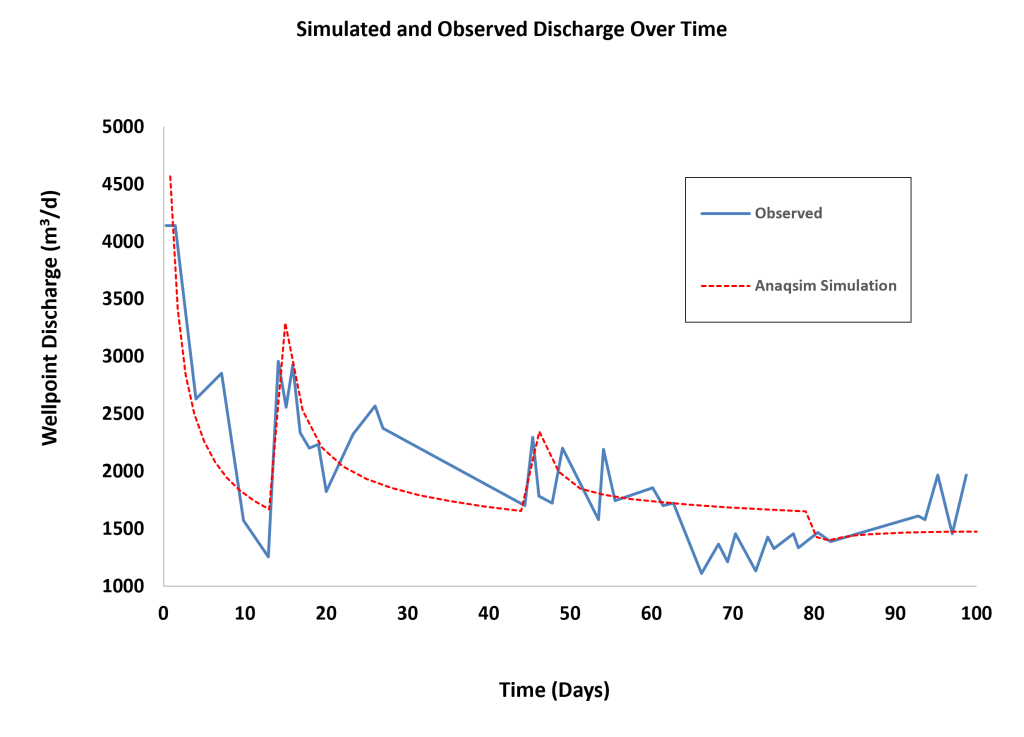
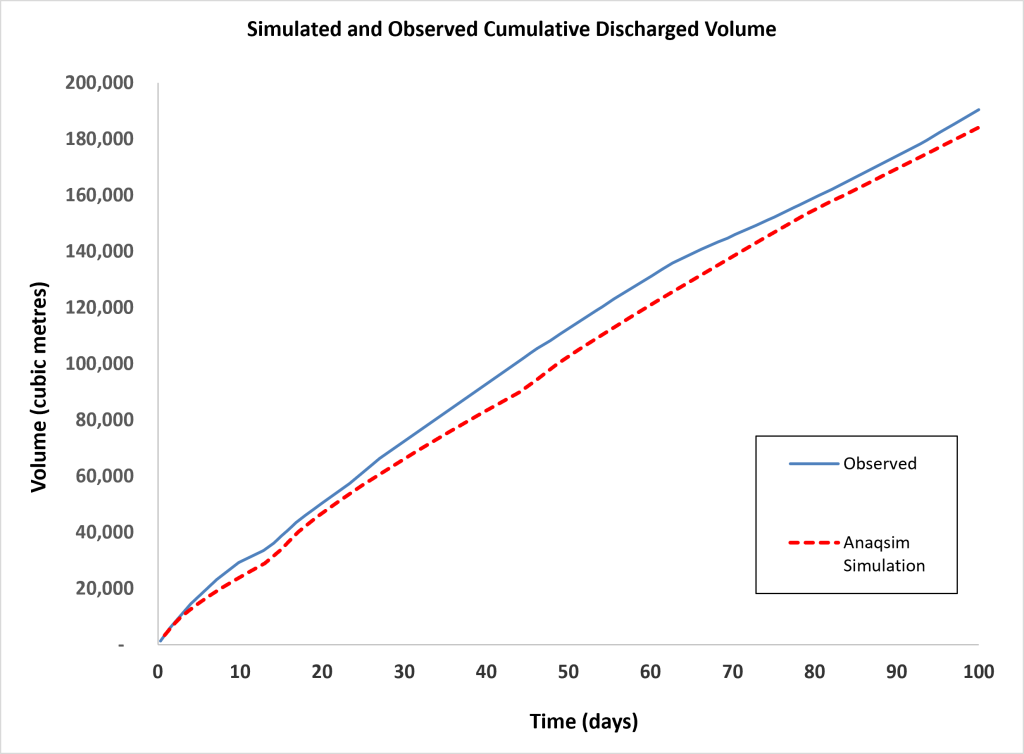
The two comparisons show model performance in two ways: discharge response over time and total groundwater removed over the full dewatering period.
Image 3 below depicts the observed and simulated discharge for the dewatering system over time. Image 4 below depicts the measured and simulated cumulative discharge over time. From these graphs, we can see that the 5-element Anaqsim model closely followed the observed dewatering response.
The model was also checked against the excavation sequence. Image 5 compares the simulated groundwater elevation at the centre of the excavation with the base of excavation. The predicted groundwater level stayed below the excavation base throughout the staged earthworks. This indicates that the simulated dewatering system would have kept the excavation dry.
The simulation captured the main stage periods as the wellpoint system advanced. It also followed the overall trend in measured discharge during construction. Field discharge measurements varied during active construction, but the simulated results reproduced the broader pattern of groundwater removal and matched the cumulative discharge over the life of the project very well.

Practical lesson for excavation dewatering models
The main lesson from this case study is that Anaqsim can handle a seemingly complex dewatering problem with a small number of well-chosen hydraulic elements.
In this case study, the real-world project included layered geology, a confined-to-unconfined aquifer response, changing excavation geometry, four stages of wellpoint installation, and 1,624 physical wellpoints. In Anaqsim, we simulated the active aquifer using three layers, placed the distal boundary far enough from the excavation to avoid undue influence on the dewatering response, and represented the staged wellpoint system with four specified-head line elements.
That setup worked because the model preserved the parts of the system that controlled the field response: staged groundwater lowering around the excavation, vertical flow within the aquifer, and total groundwater removal over time.
For your next excavation dewatering model, start with the engineering question. Do you need to estimate total discharge? Drawdown timing? Groundwater levels near the excavation? Individual well capacity? The answer should guide how much detail you add to the model.
Further Reading
Ergun, M. U., and Nalçakan, M. S. (1993). “Dewatering of a Large Excavation Pit by Wellpoints.” Proceedings of the Third International Conference on Case Histories in Geotechnical Engineering, St. Louis, Missouri, USA, 1–5 June 1993, pp. 707–711. https://scholarsmine.mst.edu/icchge/3icchge/3icchge-session05/11/
For broader guidance on excavation dewatering and groundwater control, see CIRIA’s Groundwater Control: Design and Practice, Powers et al.’s Construction Dewatering and Groundwater Control, and Cashman and Preene’s Groundwater Lowering in Construction.
For more Anaqsim Case Studies go to: https://anaqsim.com/case-studies/