
Build your second model
Let’s build a groundwater model for an island in the middle of a lake. Our example is an island in a northern Saskatchewan (Canada) lake. The island is flat (363 masl), made of fine sand with some silt, and underlain by the Canadian Shield granite bedrock (329 masl). It’s about 3.4 km long and about 1 km wide on average. The lake level is 358.5 masl, and a small stream flows southwest from the island’s centre to the lake.

Step 1: Create a new model file
- Open Anaqsim on your computer
- Go to File > Save As
- Give your new model a name
Step 2: Define your vertical layers
This is where we define our vertical layers for the model. For our purposes we only need one layer to adequately represent the island aquifer (fine sand with some silt)
- Go to the Model Input menu > Domains > Confined/Unconfined
- Fill in the input boxes as below. Notice the elevations and aquifer parameters
- Click Save (File > Save)
Don’t worry about the “average head” value – It’s just an initial guess. It’s not a sensitive parameter, and you can always change it later after running the model.

Step 3: Input horizontal boundaries
Defining head-specified boundaries
Now we will define the aquifer’s shape – which is the outline of the island since all groundwater discharges to the lake. This means we only need one boundary to define our model. This boundary is where the island meets the lake. Since the lake is at a reasonably constant level we can use a specified head boundary with a head value equal to the lake’s elevations.
- Go to Model Input > Line Boundaries > Head Specified
- Add the head boundary by copying the details below (to copy the co-ordinates to your clipboard, click the relevant link). Recall that the lake elevation is a constant 358.5 masl so that is what we will use as the ‘h_start’ and ‘h_end’ (where ‘h’ refers to head level).
- Click Save (File > Save)

Defining Rivers
Now let’s add that stream on the island. Like all line elements, streams are found under the Line Boundaries menu.
- Go to Model Input > Line Boundaries > River
- Add the stream by copying the details below. For now, just use the default settings for all the other columns. Note that when ‘Dries_up’ is ticked, Anaqsim will allow the groundwater to drop below the stream.
- Find the stream coordinates at the link below the image. Note that the stream coordinates start at the lake and move inland. So, the ‘Stage_start’ is set at the lake elevation (358.5 masl) and the ‘Stage_end’ is the highest inland stream elevation (362 masl).
- Click Save (File > Save)

Step 4: Enable recharge nodes
For this model we want to add the average annual recharge from precipitation. The units of our model are metres and days. So, the average groundwater recharge is in meters per day.
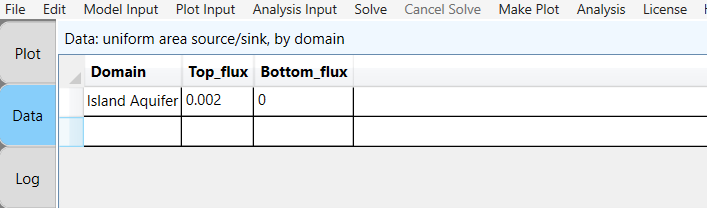
- Go to Model Input > Area Source/Sink > Uniform, Domain
- Copy the details from the image below, where the top flux is the average daily groundwater recharge rage (0.002 m/d). Since we don’t want to force any water out of the bottom of the model the bottom flux is zero. Note that the bottom flux is rarely used but handy to have.
- Click Save
Step 5: Run the model
That’s it, you have finished building the island aquifer model!
- Click Solve on the main menu bar
Anaqsim will run the simulation instantly. Look at the run log to see the simulation documented. That’s it – the model is complete!
Step 6: View and analyze your results
Now let’s see the results!
- As we noted previously Anaqsim’s viewer starts with a blank slate, so lets tell it what to display. Go to Plot Input > What to Plot and check the boxes for ‘Contours’ and ‘Vectors’
- Click Make Plot > All Selected Features Same Level / Time
You should now see the simulated groundwater flow across the island.
Congratulations! You have built the basics of the Island model – but what about if we want to add and extra feature or modify the model? Read on for more details
Modifying the Island model
We will now build on the Sandy Island model by adding a pumping well near the stream and see how it changes streamflow.
As always we will keep following the same 6 steps:
Step 1: Create a new model file
- Open Anaqsim on your computer
- Go to File > Open and open your Sandy Island Anaqsim File
- Go to File > Save as and save your file with a new name
Step 2: Define your vertical layers
Since we’re not adding layers or sub-domains in this exercise, we will leave the inputs as they are.
You could adjust these values to do a manual sensitivity analysis, or use an automated calibration tool like PEST, but for now no changes are needed.
Step 3: Input horizontal boundaries
Adding a pumping well
We will keep the island and stream boundaries as they are, but now add a pumping well.
- Go to Model Input > Pumping wells > Discharge Specified
- Place a well at co-ordinates (3400, 3000)
- Use a radius of 0.25 m
- Enter a discharge rate of -250 m3/day. Remember a negative value means pumping water out, positive is injecting water in.
- Click Save (File > Save)
Step 4: Enable recharge nodes
The model already has uniform recharge nodes to represent average groundwater recharge from precipitation. No updates are needed here.
Step 5: Run the model
- Click Solve on the main menu bar
Anaqsim will run the simulation instantly.
Step 6: View and analyze your results
Now let’s see and compare the results!
- If you previously enabled contours and vectors before, they will still display. If not: Go to Plot Input > What to Plot and check the boxes for ‘Contours’ and ‘Vectors’
- Click Make Plot > All Selected Features Same Level / Time
You will now see a ‘bullseye’ cone of depression around the pumping well. But what about the stream? let’s measure it.
- Go to Analysis > River Line Boundary discharges > Individual Reaches > Write Discharges to Run Log.
- Anaqsim will show the simulated stream discharge in the Run Log – A negative sign means groundwater is flowing into the stream.
Comparing with and without pumping
Now let’s test the stream discharge without the well.
- Go back to Step 3 and set the well discharge to 0 m3/day
- Save, then repeat steps 4 – 6
Comparing the two runs shows that pumping the well at ~250 m3/day reduces streamflow by about 145 m3/day.
Where next in our Getting Started Guide?
Get Connected
Quick Start Guide
Build Your First Model
Build Your Second Model
You are here!
Free 14-day trial
No credit-card required